
The Fed, the "Dot Plot," and a Cocktail Fork Chart

- What Do the Jobs Numbers Actually Mean?
- Here's What to Expect From the Bond Market in 2015
- WATCH: Why You Should Care About the $7 Billion Citigroup Mortgage Settlement
- Jack Bogle, Who Revolutionized the Way Millions of Americans Save and Invest, Dies at Age 89
- Why Trouble in China is Hitting Your 401(k)
Money is not a client of any investment adviser featured on this page. The information provided on this page is for educational purposes only and is not intended as investment advice. Money does not offer advisory services.
Today and Wednesday the Federal Open Market Committee, the part of the Federal Reserve that sets a key interest rate, will be meeting to discuss the state of the economic recovery and where to take Fed policy from here. Since the economic crisis, the Fed has been keeping short-term interest rates near zero. The big question on investors' minds is when will the central bank start inching rates back up, and how fast.
In his latest commentary for the giant bond-fund manager Pimco, Paul McCulley says much depends on the Fed's "blue dot" long-term rate of 4%.
Um... the what? What's a blue dot?
The Fed doesn't only affect the economy by setting interest rates. It also—maybe even primarily—tries to guide things by signaling where it wants to go. If the Fed starts hinting that in the near future it wants to raise rates, borrowers and lenders alike will in theory start to act as if that's already happening, and that by itself will start pushing the rates on loans upwards. And that's where the dots come in.
On Wednesday, the Fed will publish a chart showing where the different Fed officials think rates ought to go over the coming years and in the long term. Each official's opinion is represented anonymously as a blue dot. With no rate hike news expected, everybody is looking at the dot plot for signs of what's to come. (Even though Fed chair Janet Yellen tries to downplay it.) Here's what the last chart, published in March, looked like:
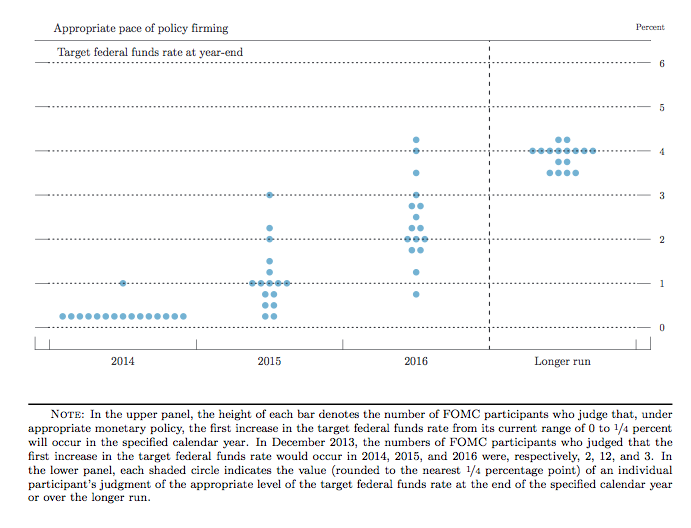
As you can see, the Fed back then thought that in the long run rates should eventually get back up to around 4%. If you're a bond investor, going from a world of nearly zero short-term interest rates to 4% is a scary prospect, since the value of older bonds falls as rates rise. Yet bond investors do not seem to anticipate 4% happening anytime soon. Treasuries have rallied so far this year, keeping the yield on 10-year securities at just 2.6%.
As The Wall Street Journal's Jon Hilsenrath reports, many market observers think 4% is now unrealistically high. Why? The answer can be summed up in this graphic that's been making the rounds over the past week, which I hereby dub the cocktail fork:
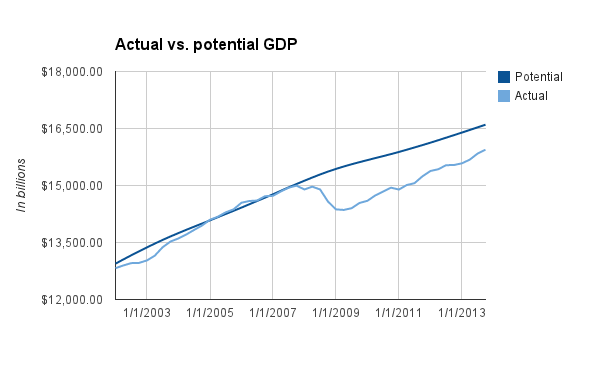
The top tine of the fork is where the Congressional Budget Office says the economy could be if it was gunning on all engines, based on the size of the workforce and the base of capital. The lower tine is where the economy actually is. The economy falls below potential during recessions, but usually climbs back up again.
All these years after the great recession, despite growth, the country still has lots of unused capacity. Although unemployment has come down (slowly), part of the drop has been due to people who've stopped looking for work. Low inflation so far suggests that workers don't feel like they have a lot of bargaining power.
If the economy really has been permanently weakened, some think rates could stay very low for a long time without igniting too much inflation. (Some on the Fed would actually welcome somewhat higher prices; inflation has a cocktail fork of its own.)
If Fed officials come around to that view, you might see some of those long-range blue dots tick down a bit on Wednesday. If they're actually optimistic about growth and ready to worry a little more about inflation, the dots might tick up. Or maybe not—doing so might set off market alarm bells that Fed officials, wishing to keep future options open, might not want to sound just yet. The dots are one way for the Fed to speak with a wink and a nod. But on Wednesday it might prefer to wink.