How Money Finds the Best Places to Live in America

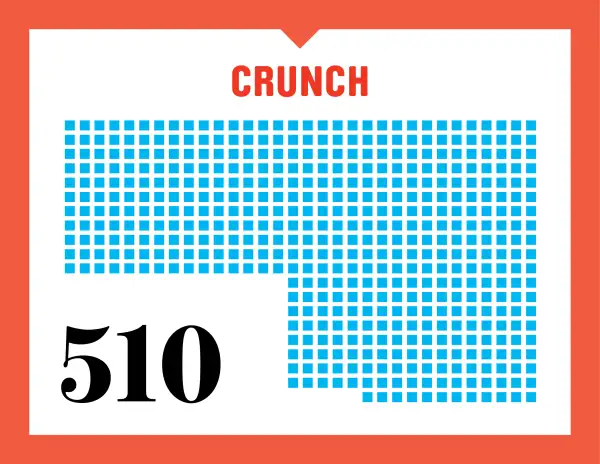
This year’s list included all U.S. towns and cities with populations of 50,000 to 300,000, for a pool of 823 to start.
To find the best, we sorted through almost 300,000 demographic data points (which is why we partner with Onboard Informatics to collect it all). For the first cut, we eliminated the 100 places with the lowest predicted job growth, the 200 communities with the most crime, and any place without a strong sense of ethnic diversity (more than 90% of one race).
Focusing further on pocketbook factors, we hunted for top home values by comparing median property values with median household incomes. We singled out communities with strong local economies and low taxes (property, income, and sales). We also considered accessibility to health care, culture, strong public schools, and sports.
To correct for geographical biases, we limited the list to no more than four places per state and one per county.
Reporters spent time in each town, interviewing residents, checking out neighborhoods, and searching for the kinds of intangible factors that aren’t visible in statistics.
Finally, we arrived at this year's Best Place to Live.
NOTES: Rankings derived from 60 data points in the following categories: jobs based on income growth, local unemployment (not seasonally adjusted; county data used when local not available), and projected job growth. Economy based on purchasing power, foreclosure rate, tax burden, and state’s fiscal strength. Housing affordability based on median price-to-income ratio and average property taxes. Education based on test scores, educational interest and attainment, and percentage of kids in public schools. Health based on number of doctors and hospitals in the area and health of residents. Crime based on property and violent crime rates. Arts and leisure based on activities in the town and surrounding area, including movie theaters, museums, and green spaces. Ease of living based on population density, commute times, weather, and other factors.
Sources: Onboard Informatics, U.S. Bureau of Labor Statistics, FBI, Moody’s, Standard & Poor’s, Kaiser Family Foundation, County Health Rankings, IRS, Tax.org, Tax Foundation, Institute of Taxation and Economic Policy, RealtyTrac, CDC, Infogroup.com, Council for Community and Economic Research, American Alliance of Museums, National Oceanic and Atmospheric Administration, National Association of Realtors, SchoolDigger, FAA, EPA, U.S. Census Bureau, U.S. Postal Service, U.S. Bureau of Economic Analysis, American Community Survey, Federal Housing Finance Agency, National Center for Education Statistics, National Center for Health Statistics, county assessors’ offices, MountainVertical.com, White Book of Ski Areas, National Assembly of State Arts Agencies, Association of Zoos and Aquariums, MCH Strategic Data, Economic Innovation Group, and League of American Orchestras.