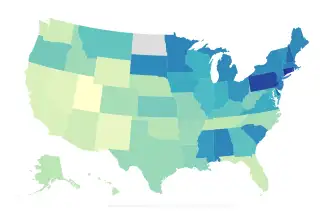
This Map Shows the Average Student Debt in Every State. See How You Compare

The amount of student debt you carry depends on plenty of variables—like what you studied, or how much aid you got.
Another huge factor: where you live.
In Utah, for example, 2017 graduates with debt had an average balance of $18,800, according to new data from an annual report on student borrowing. But in Connecticut, the typical borrower had double the debt: $38,500. Across the country, 18 states had an average debt load above $30,000.
The national average for borrowers in the class of 2017 was $28,650, up 1% from the previous year's average of $28,350, according to the report from The Institute for College Access and Success, a nonprofit that focuses on college affordability. About 65% of graduates borrowed to finance their degrees.
State borders have a lot to do with tuition costs.
Public schools in the Northeast, for example, tend to be more expensive than those in the West and South. And since the majority of college students attend public colleges in their home state, the price of public colleges has a big influence on average debt loads. The availability of aid varies by state, too.
Students who attend college in states with pricier public colleges are more likely to take on debt in the first place. In New Hampshire, where public colleges have some of the highest sticker prices, about three quarters of seniors graduated with debt in 2017. That's compared with less than 50% of students in states such as Nevada, Oklahoma, Utah and Wyoming—all of which have public colleges with prices below the national average, according to the College Board.
See the full list of states below:
The average debt also swings significantly by college, ranging from $4,400 to $58,000. At more than 200 colleges, the average debt was above $35,000, according to the study. (Money's Best Colleges rankings weigh how much students and parents borrow as a measure of college affordability. They show a similar, though smaller range: $5,800 to $40,900.)
Colleges aren’t required to report debt for their graduates, so the study's authors relied in part on voluntarily provided numbers from 1,020 colleges—about half of all of the country’s four-year, non-profit colleges. The report also used debt figures from the federal government's National Postsecondary Student Aid Study, which counts all student borrowing and is released every four years. The report does not include debt at for-profit colleges. Because not all colleges report data, the reliability of the state averages varies based on the share of graduates counted. (In the case of North Dakota, just 17% of bachelor's degree recipients in the class of 2017 were represented, so its state average was not included.)
Experts aren't sure what's behind the low 1% growth rate in borrowing. The authors of this study write that increases in state spending and grants—both of which have mostly rebounded from the depths of the Great Recession—are two contributing factors.
Others believe the growth has slowed only because students are running up against the federal borrowing limit. That limit is $31,000 for dependent students starting college this year and $57,000 for independent students.