
3 Lessons From S&P 2000

- There Are Now More Crypto Coins Than U.S Stocks
- The Best Time to Buy Bitcoin, Explained in One Chart
- This Two-Minute Viral Video Proves It's Impossible to Time the Stock Market
- AMC, GameStop and Hertz: What's Causing the Latest Meme Stock Swings?
- 5 Signs Investors Are Dangerously Overconfident Right Now
Money is not a client of any investment adviser featured on this page. The information provided on this page is for educational purposes only and is not intended as investment advice. Money does not offer advisory services.

Updated: 5:45pm
On Tuesday, the index of 500 of the largest U.S. companies dashed across the 2000 level for the first time—16 years after crossing the 1000 milestone and a week after the Dow regained 17,000.
The market's march from 1000 to 2000 will be remembered as tumultuous chapter in market history. The first S&P crossed the four-digit mark way back in February 1998, according to data from S&P Dow Jones Indices, before the bursting of the Internet bubble and the financial crisis. Between then and now, in fact, the market tumbled back to below 700 in 2009.
Here are three takeaways for investors about the journey to the 2000 mark.
1. It started in a tech rally, and it ended in a tech rally. But overall, technology has been a pretty average investment.
If you’ve been reading market news lately, you’d be forgiven for thinking the bull market is all about Apple, Google and other hot tech stocks. There's no doubt these have been big winners: Apple , which trades for more than $100 today, traded at a split-adjusted price of just 63 cents in February 1998, more than three years before the launch of the first iPod, according to S&P Dow Jones. But picking the next tech winner is no easy feat. On average, tech companies have delivered a total return of 6.1% a year since 1998. That’s actually slightly below the S&P’s 6.2% total return, suggesting plenty of losers and mediocrities offset a few fabulous winners.
2. The real boom was in energy.
If tech stocks are lagging the field, what's led it? Energy stocks have been easily the best performing sector of the S&P 500, returning nearly 11% a year, on average, over the past 16 years, says S&P Dow Jones. While oil prices are is notoriously volatile, for the past 16 years they've made a steady climb, aside from a brief plunge during the late recession. Around $22 in early 1998, a barrel of oil is more than $90 today. Because if there's one thing that's arguably bigger than the Internet revolution, it's been the the rise of developing nations like China, India and Brazil. Their growing number of factories and middle-class automobile owners have continually ratcheted up demand for energy commodities.
3. For buy-and-hold investors, dividends can be powerful over time.
While the S&P 500's milestone is certainly worth noting, it's also a reminder that paying too close attention to stock market swings isn't the best strategy. While it's taken 16 years for stock price levels to double, investors who simply bought and held stocks in a low-cost index fund could have gotten there sooner. (Somewhere around early 2013.) That's because stock-market gauges like the S&P 500 don't account for dividends. But if you hold a mutual fund that automatically reinvests dividends, your portfolio does. Dividends accounted for about a third of the S&P 500s average annual total return over the time it took for the index to rise from 1000 to 2000, according to S&P Dow Jones.
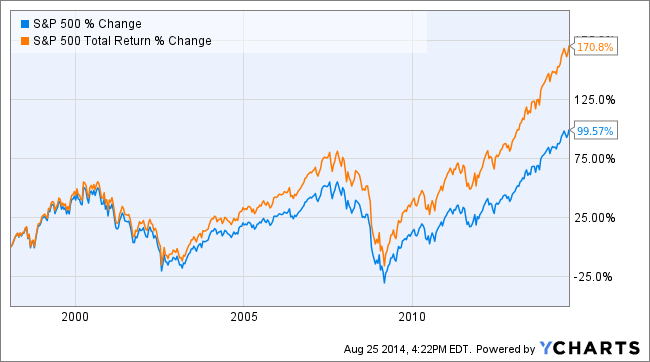
Since early 1998, including dividends, the S&P 500 is up 170% as of yesterday (see the chart above), compared to almost 100% for the raw index. We'll see if the S&P 500 can top 2000 mark today and make that a triple-digit percentage rise.