This Chart Shows the Secret to Never Losing Money in the Stock Market
Money is not a client of any investment adviser featured on this page. The information provided on this page is for educational purposes only and is not intended as investment advice. Money does not offer advisory services.

There’s a great way to get rich in the stock market. The trick? Don’t expect to do so quickly.
Year-to-year, the S&P 500 can fluctuate wildly, from gains one year to losses the next. With time, that choppiness evens out — and the chance of losing money over longer stretches diminishes. If you manage to hold out for five years, your odds of losing money are pretty slim. If you can wait for 20 years they are all but nil.
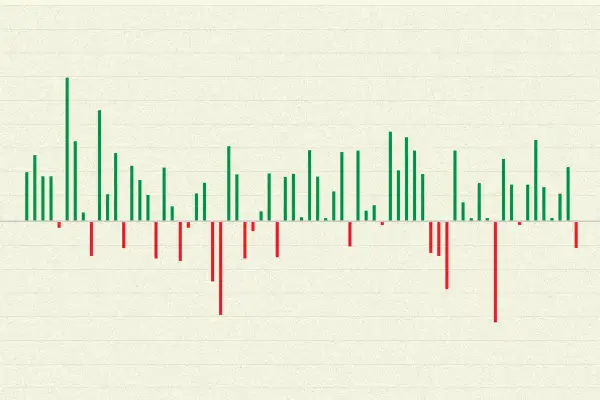
How to can you be sure? Check out the chart below which shows that annualized returns for the S&P 500 were positive for all 20-year periods between 1872 and 2018, according to The Measure of a Plan, which calculated real total returns for the index by taking into account dividend reinvestments and adjusting for inflation.
The chart is based on data collected by Yale economics professor Robert Shiller. It's apparent “there are better decades than others,” he told Money in an interview. While the market can be volatile, succumbing to occasional bear markets, investors tend to under-appreciate the value of time, he adds. “The long history is pretty good for the stock market.”
This long-term advantage of stocks versus other assets (like bonds), is hardly a new concept, as Shiller points out. Jeremy Siegel, a finance professor at Wharton, wrote the 1994 classic, Stocks for the Long Run, while Charles Amos Dice, a professor of business organization, was tackling the topic back in the 1920s with his book, The Stock Market.
If none of this is new, then why do so many well-intentioned investors continue to lose money in the stock market? The answer often boils down to a lack of patience.
Adopting a long-term mindset...
Charts like the above are a useful tool for Dean Catino when discussing the importance of a long-term investment strategy with clients. To begin, Catino will outline the S&P 500’s odds of making money in the S&P 500 on a daily basis — a little over 50%, or akin to flipping a coin, notes the president of Monument Wealth Management, an independent registered investment advisor. Then he’ll look at longer periods of time, and the improving odds of making money.
Here’s a breakdown of how annualized total returns fared over various time frames, according to the data analyzed by The Measure of a Plan:
- 1-year: From -37% to 53.2%
- 5-year: From -11.7% to 28.5%
- 10-year: From -4.1% to 17.6%
- 20-year: From 0.5% to 13.2%
While 20 years was the tipping point for a range of positive returns, many investors quickly appreciate the value of staying invested for even a 10-year period, when the probability of making money is 94%, Catino says of conversations with his clients. The problem? Long-term charts don’t show the declines that happen within a calendar year, which average more than 13%, he adds.
It’s these short-term bouts of volatility that can rattle investors with a long-term mindset, Catino notes. “If you’re going to be invested in the stock market you’ve got to give it time.”
And yet the hardest thing for many investors to do is just that: Give the market time to recover from one of its inevitable rough patches, Catino says. Because even a rational person could make irrational decisions during a stressful time, he adds.
“Having faith in a plan and a process, and knowing that markets really do return well over a longer period of time is so important,” Catino notes. “You have to have a plan; having an average plan is better than having no plan at all.”
...in a short-term world
There can be two truths for investing, however: The market is attractive as a long-term investment, and less attractive in the short-term. And appreciating the proven track record of stocks, doesn’t mean throwing all caution to the wind.
The S&P 500 has surged more than 80% since its March 2020 low, and Shiller’s go-to valuation metric for this index — the CAPE ratio, short for cyclically adjusted price/earnings ratio — is the highest it’s been since 2001, or “quite high,” he notes. In fact, Shiller says: “I’m a little fearful of another crash, actually.”
What does that mean for investors? Continue to invest in the stock market, Shiller advises, just recognize that the huge gains and high stock prices mean it’s still — as always — a risky proposition in the short-term.
“I don’t think that it’s a particularly scary time, but you might be cautious,” Shiller says. Some investors may want to consider lowering their portfolio’s exposure to stocks and taking a less aggressive investment approach for the time being, he adds.
The problem with predicting where the stock market is headed requires predicting what will happen politically, Shiller notes. Those types of unknowns create the ever-present prospect of volatility that investors must find a way to handle over time, Catino adds.
“What people want is a panacea, and it doesn’t exist in the market,” Catino says. “There’s risk, and that’s why there’s a return.”