
This Map Shows the Average Income in Every State—and What It's Really Worth

- Is Debt Settlement a Good Idea?
- Who Doesn't Have to File Taxes This Year? Details for Retirees, Students and Gig Workers
- Pell Grants Will Soon Help Students Pay for Job Training Programs
- From Loans to Jobs, Here's How the Fed Rate Cut May Affect Your Wallet
- 5 Things to Know About the Trump Administration’s Plans to Limit PSLF

Geography can transform a paycheck. That is: How much your wages are actually worth depends largely on where you live.
On some level, everyone understands that—even if you don’t have a firm grasp on precisely how far a $50,000 salary would go in California, compared with, say, Ohio. Money set out to find the answer, meshing average income data with a cost of living measurement for each state.
We pulled average pay for each state, based on 2015 median household income from the Census Bureau’s American Community Survey. Then we adjusted those figures based on each state’s 2015 “regional price parity”—a calculation by the U.S. Bureau of Economic Analysis that shows how much a certain amount of cash will buy you in a given place.
The higher the price parity number for a given state, the more residents will pay for items such as housing, food, and transportation. The BEA calculates this by looking at the price of goods and services in the Consumer Price Index, as well as rents reported to the Census Bureau’s American Community Survey. A price parity figure of 118.8, like Hawaii’s, means that goods and services there cost almost 19% more than the national average. Prices in Mississippi, meanwhile, with a price parity of 86.2, are about 14% less than the national average.
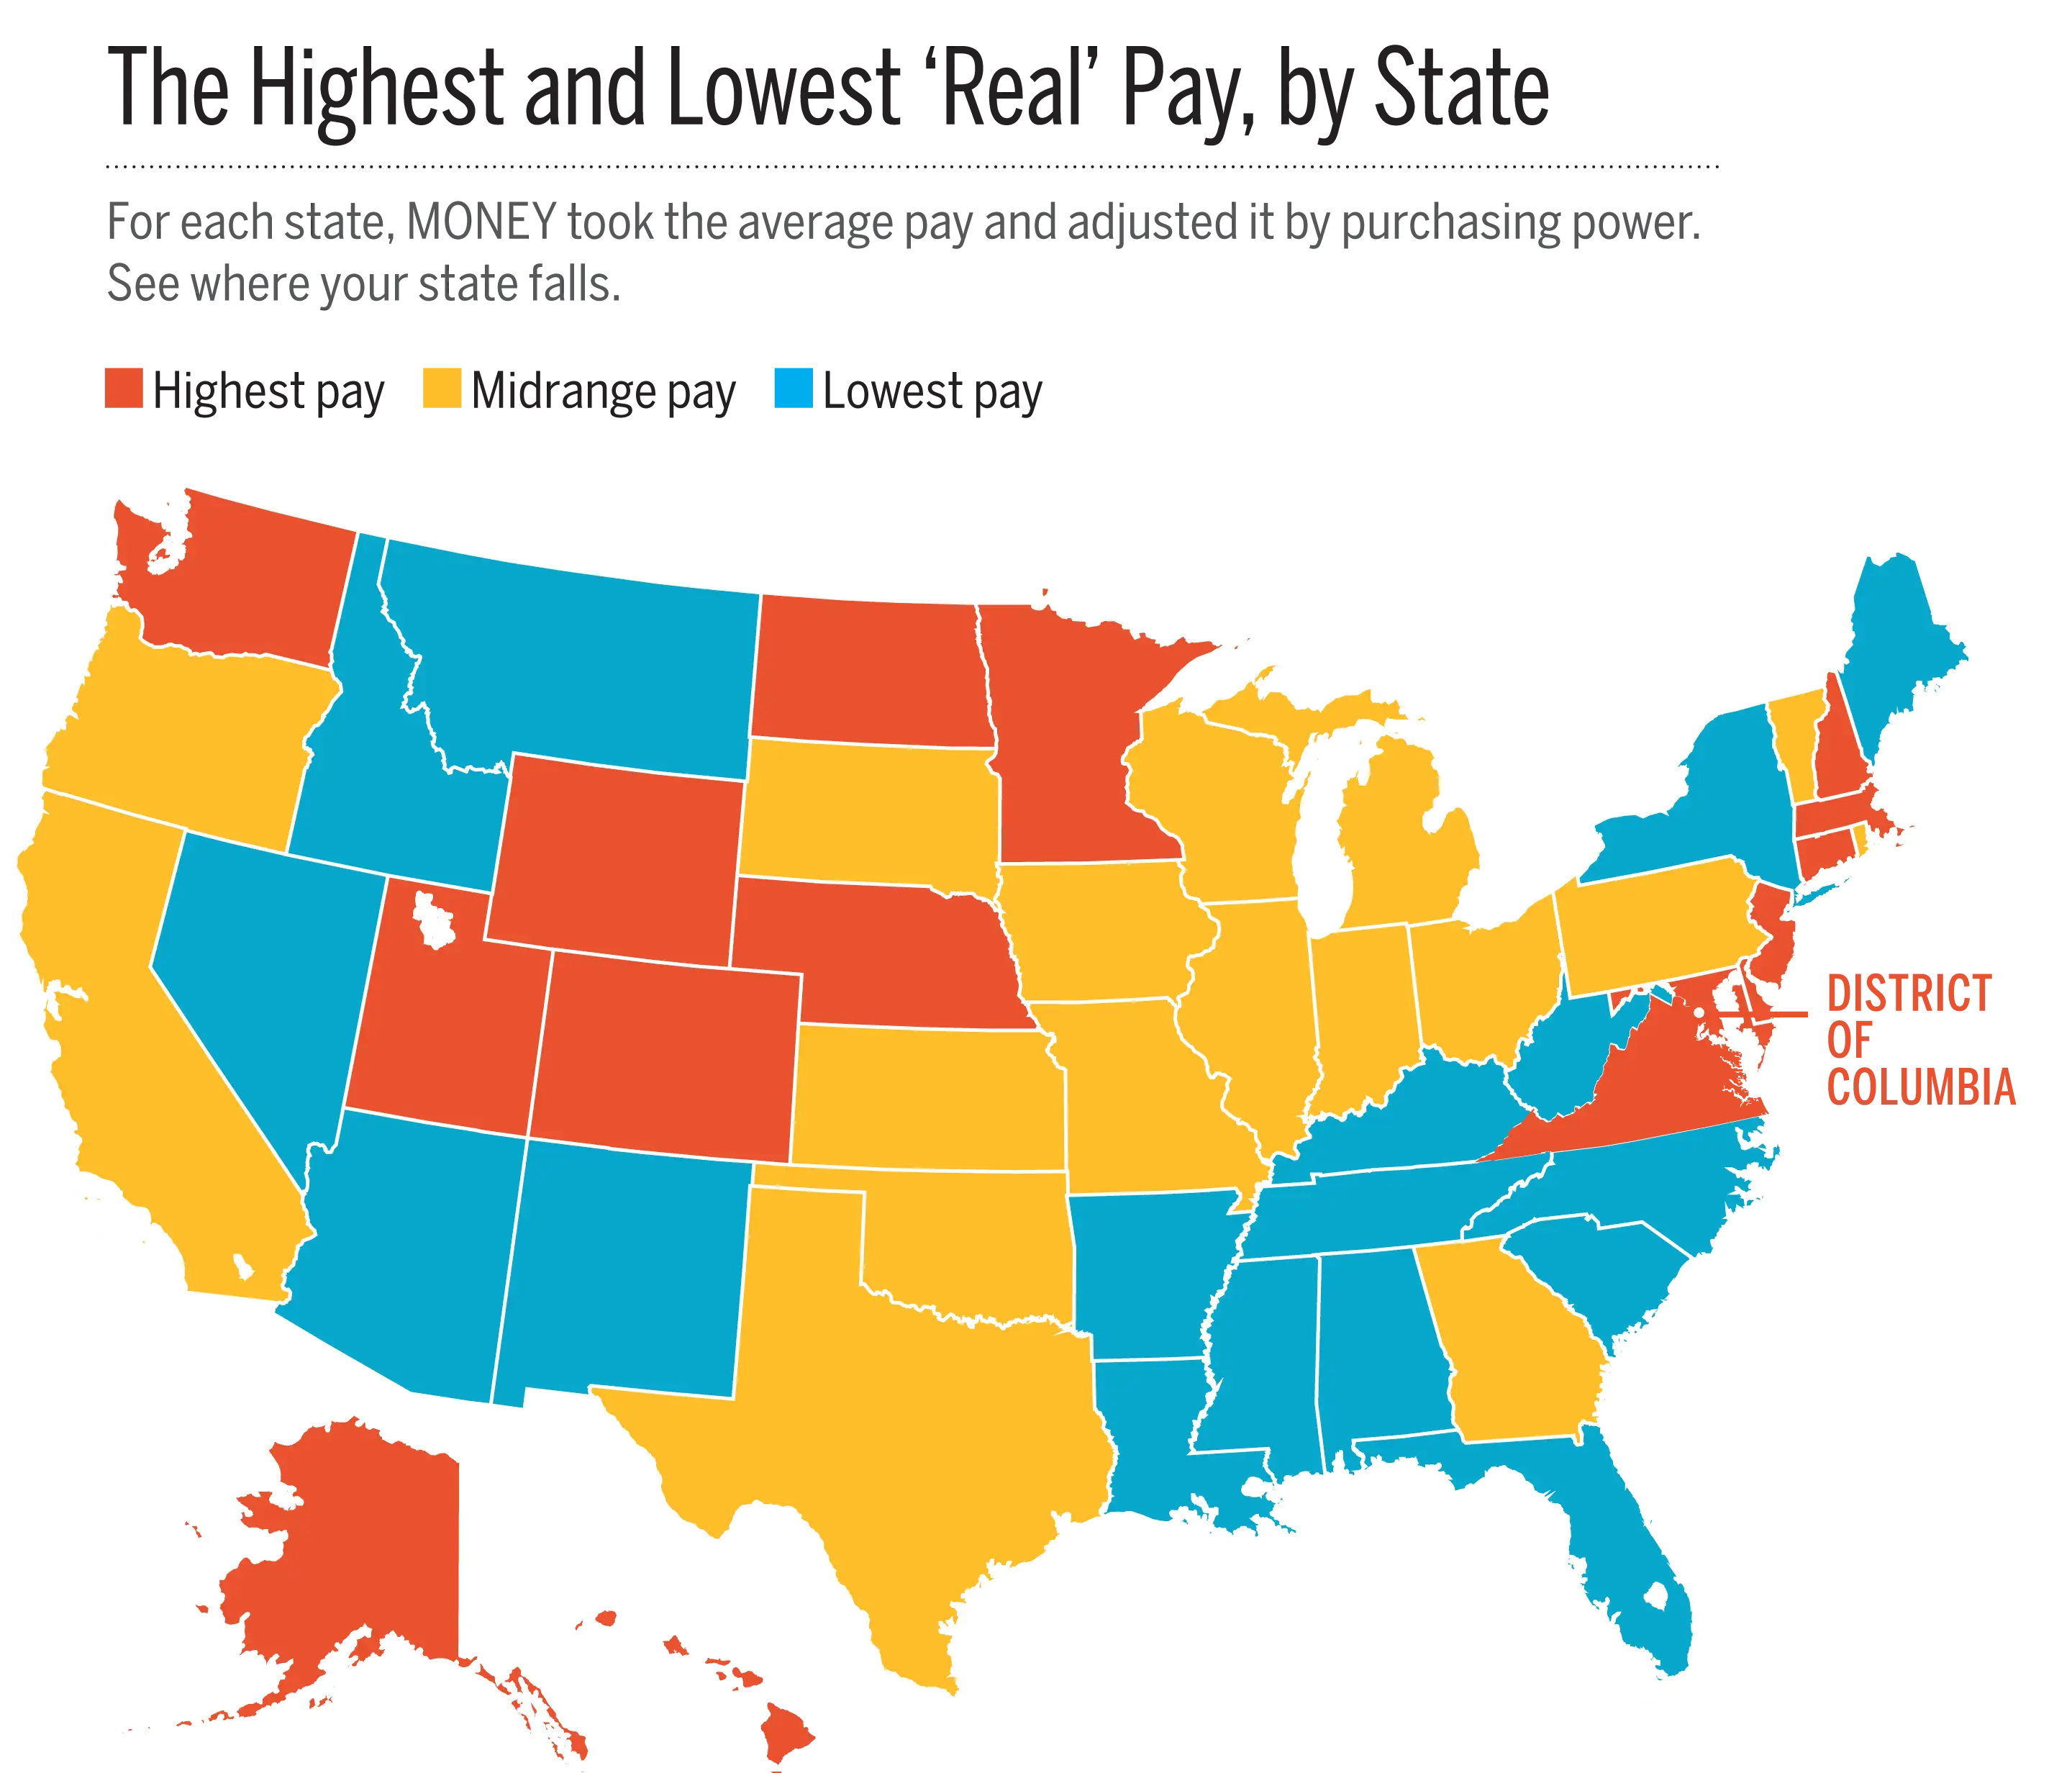
Living expenses tend to cluster by region. The Northeast is comparatively more expensive than much of the Southeast, for example. But there are considerable differences even among states that are neighbors. In Illinois, for example, the real value of $1,000 is $1,003. In next-door Indiana and Missouri, that rises to $1,103 and $1,120, respectively, since those are lower-cost states.
In some states, such as Delaware, there’s little difference between the median household income and how much it can purchase locally. Delaware has a price parity (100.4) that’s nearly in line with the national average (which gets indexed to 100). But in other areas, such as North Dakota or Massachusetts, the price parity calculation can either add or subtract thousands from an average earner's spending power.
A few notes: Household income doesn’t count non-cash benefits and doesn’t account for property or personal income taxes, other deductions, or Social Security—so it’s not the same as take-home pay. The cost of living and average income can also vary considerably within a state, so your state’s real salary may not reflect what workers in a specific city earn or pay to live.
Here are the median household incomes, regional price comparisons, and real salary values in each U.S. state.
Alabama
- Median household income: $44,765
- Regional price parity out of 100: 86.8
- Real income: $51,573
Alaska
- Median household income: $73,355
- Regional price parity out of 100: 105.6
- Real income: $69,465
Arizona
- Median household income: $51,492
- Regional price parity out of 100: 96.2
- Real income: $53,526
Arkansas
- Median household income: $41,995
- Regional price parity out of 100: 87.4
- Real income: $48,049
California
- Median household income: $64,500
- Regional price parity out of 100: 113.4
- Real income: $56,878
Colorado
- Median household income: $63,909
- Regional price parity out of 100: 103.2
- Real income: $61,927
Connecticut
- Median household income: $71,346
- Regional price parity out of 100: 108.7
- Real income: $65,636
Delaware
- Median household income: $61,255
- Regional price parity out of 100: 100.4
- Real income: $61,011
District of Columbia
- Median household income: $75,628
- Regional price parity out of 100: 117
- Real income: $64,639
Florida
- Median household income: $49,426
- Regional price parity out of 100: 99.5
- Real income: $49,674
Georgia
- Median household income: $51,244
- Regional price parity out of 100: 92.6
- Real income: $55,339
Hawaii
- Median household income: $73,486
- Regional price parity out of 100: 118.8
- Real income: $61,857
Idaho
- Median household income: $48,275
- Regional price parity out of 100: 93.4
- Real income: $51,686
Illinois
- Median household income: $59,588
- Regional price parity out of 100: 99.7
- Real income: $59,767
Indiana
- Median household income: $50,532
- Regional price parity out of 100: 90.7
- Real income: $55,713
Iowa
- Median household income: $54,736
- Regional price parity out of 100: 90.3
- Real income: $60,616
Kansas
- Median household income: $53,906
- Regional price parity out of 100: 90.4
- Real income: $59,631
Kentucky
- Median household income: $45,215
- Regional price parity out of 100: 88.6
- Real income: $51,033
Louisiana
- Median household income: $45,727
- Regional price parity out of 100: 90.6
- Real income: $50,471
Maine
- Median household income: $51,494
- Regional price parity out of 100: 98
- Real income: $52,545
Maryland
- Median household income: $75,847
- Regional price parity out of 100: 109.6
- Real income: $69,203
Massachusetts
- Median household income: $70,628
- Regional price parity out of 100: 106.9
- Real income: $66,069
Michigan
- Median household income: $51,084
- Regional price parity out of 100: 93.5
- Real income: $54,635
Minnesota
- Median household income: $63,488
- Regional price parity out of 100: 97.4
- Real income: $65,183
Mississippi
- Median household income: $40,593
- Regional price parity out of 100: 86.2
- Real income: $47,092
Missouri
- Median household income: $50,238
- Regional price parity out of 100: 89.3
- Real income: $56,258
Montana
- Median household income: $49,509
- Regional price parity out of 100: 94.8
- Real income: $52,225
Nebraska
- Median household income: $54,996
- Regional price parity out of 100: 90.6
- Real income: $60,702
Nevada
- Median household income: $52,431
- Regional price parity out of 100: 98
- Real income: $53,501
New Hampshire
- Median household income: $70,303
- Regional price parity out of 100: 105
- Real income: $66,955
New Jersey
- Median household income: $72,222
- Regional price parity out of 100: 113.4
- Real income: $63,688
New Mexico
- Median household income: $45,382
- Regional price parity out of 100: 94.4
- Real income: $48,074
New York
- Median household income: $60,850
- Regional price parity out of 100: 115.3
- Real income: $52,775
North Carolina
- Median household income: $47,830
- Regional price parity out of 100: 91.2
- Real income: $52,445
North Dakota
- Median household income: $60,557
- Regional price parity out of 100: 92.3
- Real income: $65,609
Ohio
- Median household income: $51,075
- Regional price parity out of 100: 89.2
- Real income: $57,259
Oklahoma
- Median household income: $48,568
- Regional price parity out of 100: 89.9
- Real income: $54,024
Oregon
- Median household income: $54,148
- Regional price parity out of 100: 99.2
- Real income: $54,585
Pennsylvania
- Median household income: $55,702
- Regional price parity out of 100: 97.9
- Real income: $56,897
Rhode Island
- Median household income: $58,073
- Regional price parity out of 100: 98.7
- Real income: $58,838
South Carolina
- Median household income: $47,238
- Regional price parity out of 100: 90.3
- Real income: $52,312
South Dakota
- Median household income: $53,017
- Regional price parity out of 100: 88.2
- Real income: $60,110
Tennessee
- Median household income: $47,275
- Regional price parity out of 100: 89.9
- Real income: $52,586
Texas
- Median household income: $55,653
- Regional price parity out of 100: 96.8
- Real income: $57,493
Utah
- Median household income: $62,912
- Regional price parity out of 100: 97
- Real income: $64,858
Vermont
- Median household income: $56,990
- Regional price parity out of 100: 101.6
- Real income: $56,093
Virginia
- Median household income: $66,262
- Regional price parity out of 100: 102.5
- Real income: $64,646
Washington
- Median household income: $64,129
- Regional price parity out of 100: 104.8
- Real income: $61,192
West Virginia
- Median household income: $42,019
- Regional price parity out of 100: 88.9
- Real income: $47,265
Wisconsin
- Median household income: $55,638
- Regional price parity out of 100: 93.1
- Real income: $59,762
Wyoming
- Median household income: $60,214
- Regional price parity out of 100: 96.2
- Real income: $62,593
This story has been updated to clarify that household income figures for each state are median household income, and to correct an error in the map graphic and North Dakota's median household income.