
Bitcoin 'Resistance': Why Crypto Traders Are Obsessed With This Simple Investing Concept
Money is not a client of any investment adviser featured on this page. The information provided on this page is for educational purposes only and is not intended as investment advice. Money does not offer advisory services.
If you follow the crypto world, you’ve probably read a lot about “resistance” and “support.” They may sound like references to politics, or perhaps even a therapy session, but these are actually long-standing investing terms.
To understand Bitcoin's wild price swings, it helps to know something about an old, but somewhat obscure, corner of the investing world known as "chart-based" or "technical" analysis that gives rise to the ying-and-yang concepts of resistance and support.
Charting is the idea that rather than focus on a stock's "fundamentals" — like revenue, earnings or dividends — analysts can predict where it's headed next based on the patterns analysts discern in recent price movements.
The notion is that an investor's psychology matters, and that investors tend to react to certain events — like a big price gain or drop — the same way time after time. Therefore, charting analysts believe that by studying price charts to see how investors have responded in the past, they will be able to predict where a stock or, for that matter, any other asset, is headed next.
To be sure, charting has plenty of detractors. Unlike, say, looking for underpriced "value" stocks, there isn't a library of storied academic research to back charting up. Writer and pundit Felix Salmon even went so far as to call it “the financial equivalent of astrology.”
Despite charting's shortcomings, it's taken on an outsize role in the cryptocurrency markets — in part because investors don't have much else to rely on. “Ultimately, there are no fundamentals in crypto markets,” says Victor Hogrefe, a computer scientist and cofounder of EonLabs, a software firm that designed an algorithm to trade cryptocurrencies using technical analysis. “There’s no companies…it’s all speculative value.”
What is Resistance, and Where Do You See it on Bitcoin Charts?
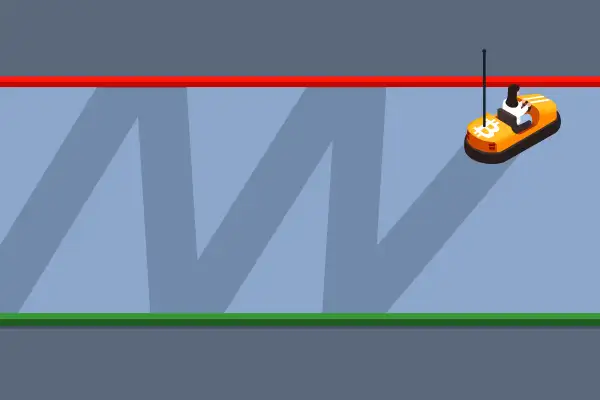
Among the most important trend indicators for chart followers are support and resistance. Simply put, support is a price where an investment like Bitcoin has consistently bounced after a correction; resistance is the flip side, the level where an investment has consistently peaked after a rally.
According to technical analysis, the more times an investment is knocked back by resistance, the more stiff the resistance becomes. For instance, if you pull up a chart of Bitcoin in 2021, you will see what looks like the profile of the Swiss Alps. There’s a series of peaks, ranging from January to June around the $40,000 price level, followed by valleys of various depths.
Then there is another series of higher peaks, reached in March, April and mid-October. These are around the $60,000 price level, which happens to be close to Bitcoin's all-time high.
One thing that may stand out to even a casual observer: The steady rows of peaks are consistently close to $10,000 milestones. “People tend to gravitate to those round psychological levels,” says Edward Moya, senior market analyst at foreign-exchange brokerage OANDA Group.
The psychological explanation for resistance levels at $10,000 increments is simple enough, according to experts. Once Bitcoin's price hits a new milestone high, it generates headlines and commentary that investors tend to remember. And once so many investors have a certain number like "60" flashing in their minds, the price tends to get stuck there. That is, until Bitcoin gets close enough to $70,000 or $80,000 that those prices seem like a real possibility, and a new number begins to appear in an investor's minds' eye.
And, of course, all this talk about "resistance" can become a self-fulfilling prophecy. “There’s this psychological game where everyone in the market knows that everyone else knows there’s a resistance level and responds to that,” says Hogrefe.
Does Technical Analysis Work?
While it's not hard to spot the basic patterns of resistance in Bitcoin's past rallies, so far, the cryptocurrency has always eventually pushed higher. To chart watchers, when an investment closes above resistance levels for two sessions or more, it’s known as a “breakout,” and the investment is thought to gather more momentum.
Despite the uncertainty, Hogrefe’s partners at Hoovest Financial have seen the chart-based trading algorithm he helped design perform well. In the last 12 months, the algorithm’s investment strategy has risen sixfold, Hogrefe claims, surpassing the returns of Bitcoin itself. The algorithm’s accuracy is about 40% to 60% (or a little better than a coin toss), according to Hogrefe.
Still, for most investors, there can be a world of difference between spotting the occasional pattern and using that observation to actually make money trading stocks, crypto or anything else. Even if you think you see a pattern, it can be hard to know whether the next breakout will come or whether it will lead up or down.
“Technical analysis is not helpful,” said Laszlo Birinyi, founder of the Wall Street research firm Birinyi Associates in an Amazon.com interview connected to his memoir The Master Trader. “From the perspective of many years on the Salomon Brothers trading desk, we found it to be of almost no value.”
More from Money:
Robinhood for Beginners: A Complete Guide to Investing With the Controversial Stocks App