How Much Do the Rich Really Pay in Taxes? This Simple Chart Will Tell You

How much taxes do the rich really pay compared to everyone else? It’s a question Americans can’t seem to stop arguing over. Perhaps one reason for the disagreement: If you’re conservative, the real answer may be a lot less than you assume. If you’re a liberal, it may be a lot more than you think.
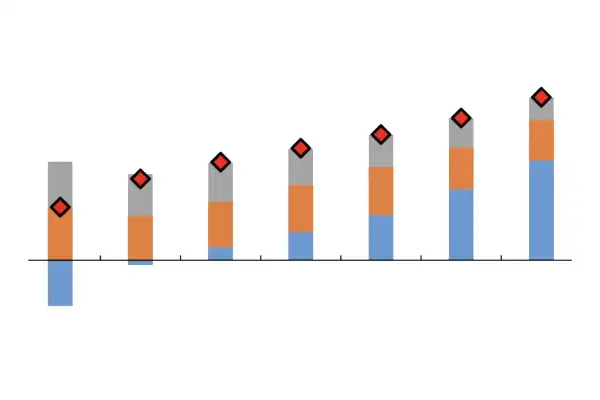
Take a look at this recent chart posted on Twitter by Harvard economics professor Jason Furman, which puts things in perspective. Based on 2016 data from the Congressional Budget Office, it shows some taxes we pay — such as the federal income tax — are very progressive. That means the wealthier you are, the more you pay. But other types of taxes are much less so.
Looking at just federal income tax, the chart shows a system tilted dramatically in favor of the least wealthy. Those in the lowest income quintile, earning up to $23,000 for a single person, actually get money back from the federal government; while middle-class earners in the fourth quintile, with income of $58,000 to $89,000 for singles, pay a rate of 6.7%; and the rich, the top 1% of earners taking home $387,000 or more, pay 23.7%. (While Furman does believe that the Trump Administration’s 2017 Tax Cuts and Jobs Act benefits the wealthy more than the rest, he believes the progressive tax rate curve is little changed as a result.)
When most Americans talk about their “tax rate,” they often talk about what they pay in federal income taxes. When fiscal conservatives fend off proposals to increase taxes on the rich by insisting the tax code is already progressive — as Kentucky Senator Rand Paul recently did on The View — this is what they mean.
But federal income taxes aren’t the whole picture. State and local taxes, (in grey), and other federal taxes (in orange) — predominantly payroll taxes like Social Security and Medicare — are relatively regressive, meaning that the poor pay a larger share of their wages than the wealthy.
One big reason for this: Social Security and Medicare disproportionately benefit the less-well-off. Unlike spending for, say Defense or the National Endowment for the Humanities, much of what Washington collects from poor taxpayers in terms of payroll taxes it simply turns around and hands back to them.
All the same, liberals, who tend to feel the government should do yet more to level the economic playing field, frequently point out the bite these taxes take from working Americans’ paychecks. That was the perspective emphasized in a recent, much-talked about New York Times article based on new economic research which theorizes the ultra, ultra-wealthy — the 400 highest earning Americans — may be paying less in taxes than everyday Americans.
So how much do the rich and poor really pay?
Take a look at the red triangles in the chart above, which combine all three major types of taxes: income, payroll and state and local. They suggest the overall tax code is indeed progressive, although not nearly as much as you might think by looking at just federal income taxes.
Perhaps the biggest loser in all this are government programs like defense and infrastructure. “We’re generally paying less in taxes today than we were a couple of decades ago,” Furman says, reached by phone. “We’re paying less in capital gains at the top, and less in the middle and lower end of the scale because of expanded tax credits.”