
This One Chart Can Help You Retire Richer

Money is not a client of any investment adviser featured on this page. The information provided on this page is for educational purposes only and is not intended as investment advice. Money does not offer advisory services.
We're all familiar with the caveat that past results are no guarantee of future performance. While that's true, understanding how different investments have performed in the past — how volatile they've been, the returns they've earned in markets good and bad, and how they've fared relative to one another — is crucial to creating a retirement portfolio that jibes with your tolerance for risk.
And when it comes to gleaning investment insights from the past that can improve your prospects for a secure retirement in the future, I can think of few better resources than the Callan Periodic Table of Investment Returns, which I call The Mother of All Investment Tables.
At this point you're probably thinking, Wait a minute. Isn't the periodic table something students study in high-school chemistry class? And it is. But Callan's version has a twist.
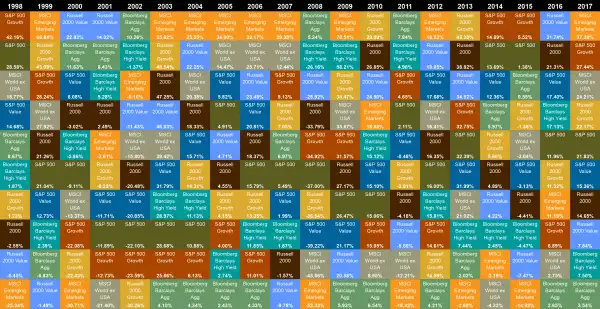
Instead of listing the 118 chemical elements by their atomic numbers from #1, hydrogen to #118, oganesson, it shows 20 calendar years' worth of investment returns (1998 through 2017 for the recently published 2018 edition) for 10 different asset classes, including U.S. and international stocks as well as domestic bonds.
The assets are ranked each year from the best to worst performers, plus they're color-coded, creating a colorful checkerboard pattern of 200 squares or cells (10 asset classes for each year x 20 years). The table not only lays out two decades' worth of performance history for a broad swath of investments, it also allows you to see which of those investments have been leaders or laggards from one year to the next.
So what practical lessons can you apply to investing your retirement savings by perusing this comprehensive view of the ebb and flow of the markets?
Lesson #1: The Unpredictability of Investment Returns
I'd say one key lesson is the futility of trying to predict returns for various investments as well as how they'll perform relative to one another from year to year.
The investment markets are far too uncertain and variable to make such attempts anything more than guesswork. And, indeed, not only does the table show that the returns of individual asset classes change from year to year, it also demonstrates the variability of the rankings themselves.
Not once did they remain exactly the same over the 20 years covered by the table.
That said, while there are exceptions, some asset classes have been more likely to turn up at or near the top than others.
For example, growth investments have tended to outrank their value counterparts, and small stocks have been more likely outperform large-company shares. That's hardly surprising, though, as small stocks and growth shares are far more volatile.
What's important to remember, though, is that greater volatility typically comes with considerable downside risk.
Take emerging market stocks. They topped the charts nine times over this 20-year period, which is more than any other asset class. But they also landed at the very bottom six years, more often than any other equity investment.
What's more, when emerging markets stumbled, they typically fell harder than other asset classes, as was the case in 2008 when they lost more than 50% of their value. Which means if you're thinking of shooting for higher returns by emphasizing investments that are grabbing headlines for their spectacular returns, you'd better be prepared for the possibility of a white-knuckle roller-coaster ride.
Lesson #2: The Importance of 'Ballast'
Another important takeaway from the Callan table is the value of holding a portion of your nest egg in a safe haven like investment-grade bonds (as opposed to high-yield, or junk, bonds, which are more volatile and tend to move more in synch with stocks than bonds).
At first glance, you might be tempted to skip high-quality bonds altogether.
After all, the investment-grade bond market (represented in the table by the Bloomberg Barclays Aggregate bond index) posted the lowest annual return more often than any other asset class, nine times over this 20-year stretch.
But you don't invest in high-grade bonds in hopes of earning outsize returns, especially these days given their stingy yields. Rather, you want them in your retirement nest egg to smooth out stocks' ups and downs and most of all to provide some downside protection when the stock market takes a dive.
And on that score, they've performed rather well. In the financial crisis year of 2008, they were the top performer, returning a bit over 5% vs. a 37% loss for the Standard & Poor's 500.
Similarly, when stock values plummeted between 2000 through 2002 following the dot-com bust, investment-grade bonds generated double-digit or near double-digit annual returns.
Lesson #3: The Importance of Diversification
I'd say the single most valuable lesson you can draw is the benefit of diversifying.
It may be tempting to concentrate your holdings into one or two hot asset classes in hopes they'll continue to sizzle in subsequent years or to try to predict which investments currently at or near the bottom of the rankings will move up the ladder.
But if your bet turns out wrong, you could end up with disappointing returns, or at the very least have to endure watching the value of your retirement savings swing widely from year to year. So rather than tying your retirement prospects to a bet on one or two assets, you're better off spreading your money around and owning a wide array of stocks and bonds that can generate reasonable returns without gut-wrenching volatility.
Fortunately, it's not too difficult these days to build a diversified portfolio consistent with your tolerance for risk that includes pretty much all the different investments represented in Callan's table.
One way to do that is by assembling a group of individual funds or ETFs each of which provides exposure to a specific asset class — large-company stocks, small shares, government and corporate bonds, etc.
Or you can achieve essentially the same level of diversification more easily by putting together a portfolio of index funds that track broad segments of the financial markets.
That might include a total U.S. stock index fund or ETF for domestic stocks; a total international stock index fund or ETF for foreign developed and emerging market shares, and a total U.S. bond market index fund or ETF for the taxable bonds market. (International bonds aren't included in the Callan table, but if you want to diversify your bond stake beyond domestic issues, you can add a total international bond index fund to your holdings.)
Whichever route you take, a good place to start your search for specific investments is with the Money 50/50, an assortment of 50 top mutual funds and 5o top ETFs to help build a long-lasting portfolio that have been screened by Money editors and that cover a broad spectrum of asset classes and investing styles.
Walter Updegrave is the editor of RealDealRetirement.com. If you have a question you would like Walter to answer online, send it to him at walter@realdealretirement.com. Follow Walter on Twitter at @RealDealRetire.
More From RealDealRetirement.com: How to Factor Social Security Into Your Investing Strategy