
This Map Shows the Fastest Growing Job In Every State — And Where New Hires Make Over $100,000

- When Does Tax Season Start in 2021?
- Your Second Stimulus Check Might Come in the Mail Even if Your First Was Direct Deposit
- Today Is Black Women’s Equal Pay Day. This Chart Shows Exactly How Big That Pay Gap Is
- Trump Supporters and Critics Agree on Need for a Second Stimulus Check in New Money Survey
- Nearly Half of Americans Say They Won't Be Able to Pay Their Bills Without a Second Stimulus Check, New Money Survey Finds
Word to the wise for anyone looking for a job in 2019: steer clear of switchboards and look to the food industry instead.
The U.S. is expected to add about 4.6 million new jobs to the workforce from 2017 to 2019, according to occupational projections website Projections Central, and the most recent monthly jobs report showed that the U.S. had added more jobs than it had in almost a year. In fact, 2018 was our best December since 1999.
That said, not all industries are faring equally. High-paying jobs are becoming harder to find as unemployment stays below 4% and in many sectors, automation like self-operating assembly machines and phone attendant systems are taking over jobs once done by people, depressing job growth.
On the other hand, low wage service sector jobs that can't be done by a computer — like serving food and nursing — continue to thrive.
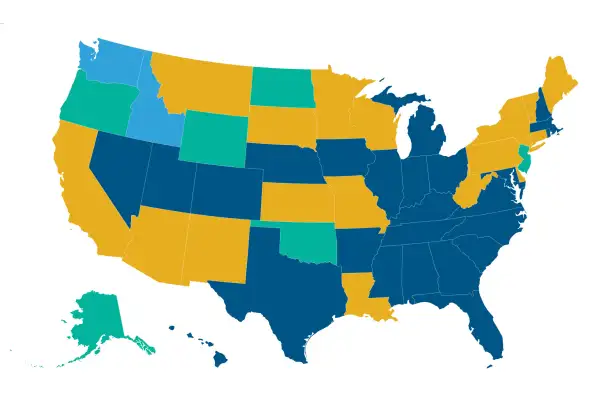
Here's a state-by-state breakdown of the 4.6 million new jobs:
Of the professions outlined in the map above, “Combined Food Preparation and Serving Workers, Including Fast Food" comes up most frequently. That's right — any position that requires employees to both prepare and serve food or nonalcoholic beverages is projected to be the most available job in 26 different states.
And it makes sense that the job with the most openings would be one that doesn't require a very high pay. Of the states hiring more fast food workers than anyone else, the highest paid are in Hawaii, according to the Bureau of Labor Statistics, and the median annual salary for fast food workers in Hawaii was $25,459.20 as of May 2017. That's about $12.24 an hour — only $2.14 more than Hawaii's minimum wage.
Meanwhile, there are only two places in the U.S. expected to have more openings for a six-figure job than any other: Washington and the District of Columbia. Between 2017 and 2019, Washington was projected to hire 9,160 application software developers (median annual salary of $147,774.40), and D.C. was projected to hire 1,120 lawyers (median annual salary of $161,907.20 in 2017). In fact, 42 of the states are hiring most for jobs that don't crack $30,000 a year.
It's also important to note that these are net gains, meaning the states are adding more openings across all occupations than they're removing. Every state is expected to remove openings — this map just shows the ones losing the most.
Secretaries in particular are taking a hit: In total, 13 states are removing more secretary and administrative assistant positions (executive and lower) than any other job. Other industries losing the most openings in a state are bus drivers for schools and special clients (Maryland), gaming dealers (Nevada), and switchboard operators (Colorado).
On a macro level, the data shows that the U.S. is expected to increase its job opportunities by 3%, with every state and territory showing some degree of growth individually.
(This excludes job openings that result from people leaving the labor force or making a significant occupational change.)
If the projections are accurate, the U.S. would have 160.13 million jobs by the end of 2019. As of the end of 2018, the labor force — people who were either working or looking for work — was 163.24 million.
Correction: A previous version of this story said California was losing more bus drivers for schools and special clients than any other occupation.