
This Chart Shows Why Stock Market Investors Shouldn't Sweat Up and Down Days
Money is not a client of any investment adviser featured on this page. The information provided on this page is for educational purposes only and is not intended as investment advice. Money does not offer advisory services.
It’s been a relatively calm year in the U.S. stock market, a phenomenon that makes some investors nervous that stocks are overdue for a selloff.
When the S&P 500 slumped nearly 1.6% on July 19, it had been just over two months since the market fell a comparable amount and only the fifth decline in excess of 1.5% so far this year. The market feels more subdued because it is, especially compared with a raucous 2020, when the S&P 500 fell at least 1.5% on 35 different days.
A typical day for the stock market often is pretty unremarkable, with the S&P 500 closing higher more often than not. A vast majority of days — or 76% of the time, going back to 1970 — this benchmark posts a daily move that’s within a pretty narrow band ranging from -1% to +1%. While daily swings in excess of 1% do happen with a fair amount of regularity, their mere occurrence is considered volatility.
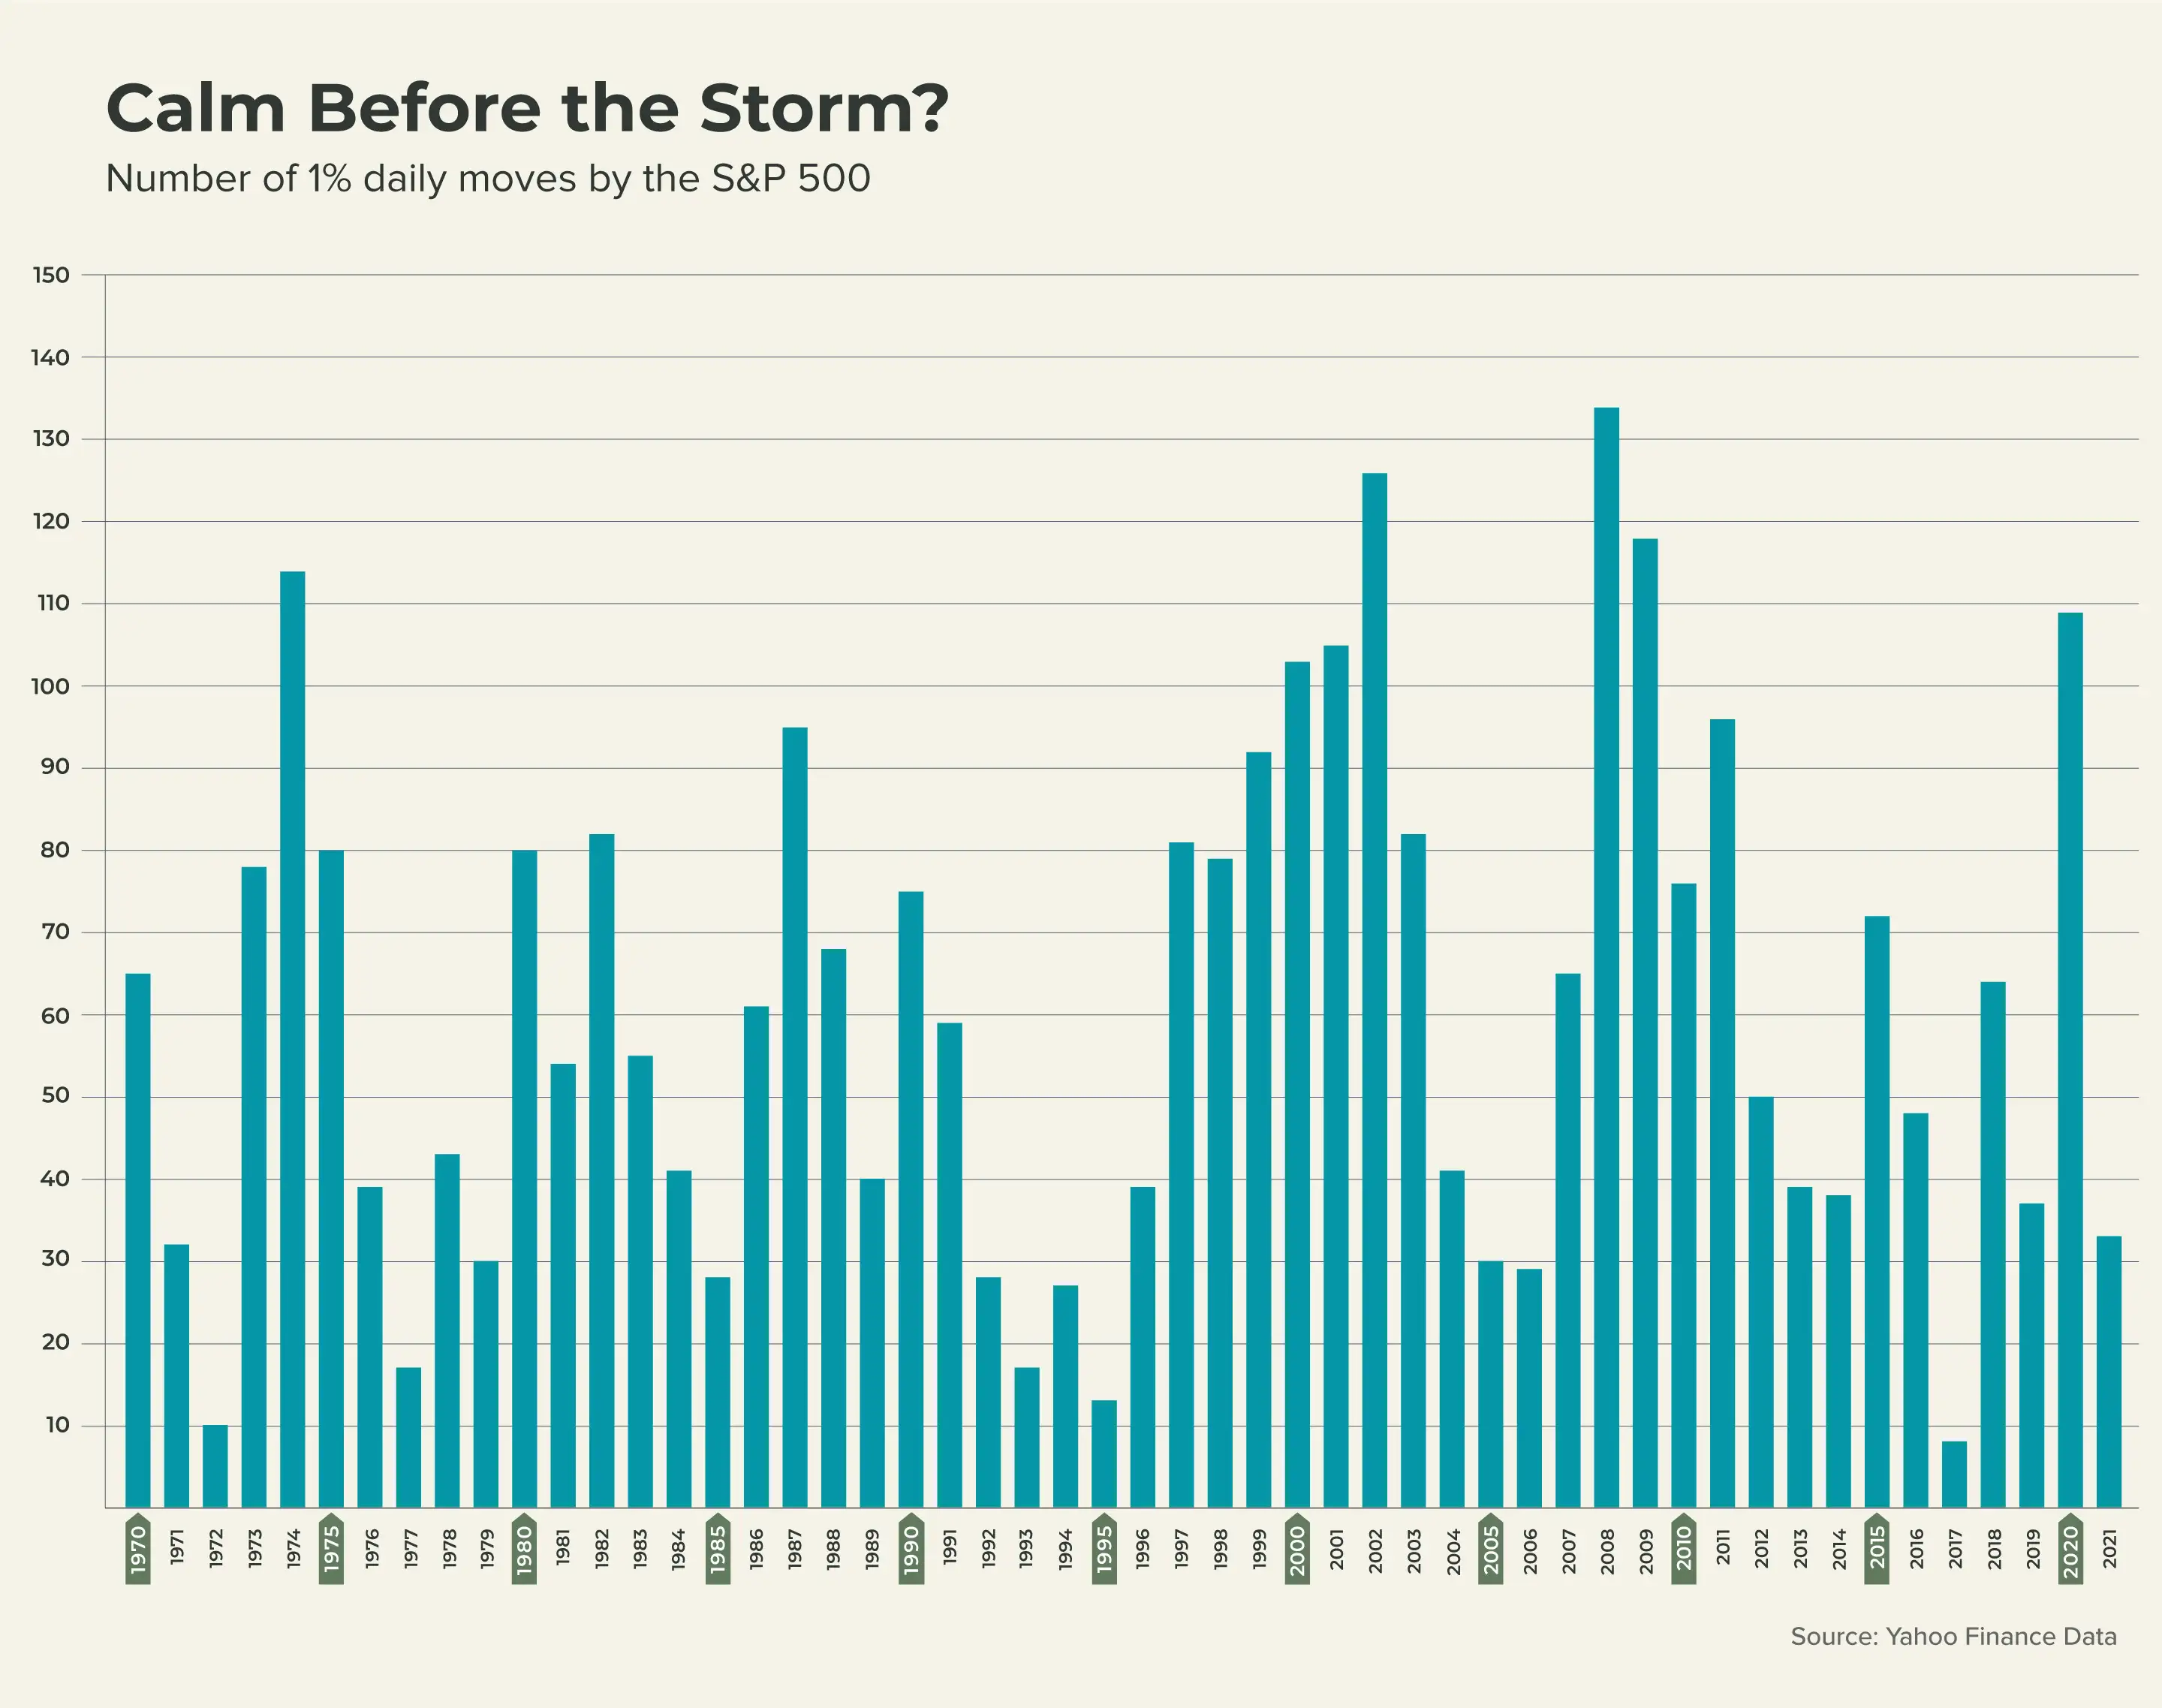
The presence, or lack thereof, of market volatility has broader implications. A spike in the number of daily moves of at least 1% in either direction tend to occur around big declines for the S&P 500, ranging from bear markets to short-term crashes, according to Frank Cappelleri, a strategist at Instinet. Meanwhile, a relative lack of 1% moves tends to accompany the market’s periods of uptrends. Through July, the S&P 500 was up 17%, nearly double its long-term average of about 10% annual returns.
The market’s doing well, which causes angst among others. Why? Beyond that relative lack of major daily dips for the market, there also hasn’t been a more prolonged and pronounced decline, or what’s known as a market correction.
On average, the S&P 500 experiences about three selloffs of a magnitude of 5% to 10% each year, according to figures compiled by LPL Research. It’s now been more than nine months since the last such pullback in October 2020.
For investors who have become accustomed to a market that keeps notching one new record high after another, they could be in for a wake-up call. August has seen some wild trading in recent memory, including in 2019, when the S&P 500 lurched up or down by at least 1% on half of trading days. And September historically is the worst month of the year, with the benchmark falling 1%, on average, going back to 1928, according to data compiled by Yardeni Research.
Complacent investors may want to buckle up for the prospect of more volatility ahead.
More from Money:
Gen Z Is Rewriting the Rules for Personal Finance in Real Time. That's Good, Right?