
Inverted Yield Curve: What This Key Market Indicator Means for Your 401(k)


Money is not a client of any investment adviser featured on this page. The information provided on this page is for educational purposes only and is not intended as investment advice. Money does not offer advisory services.
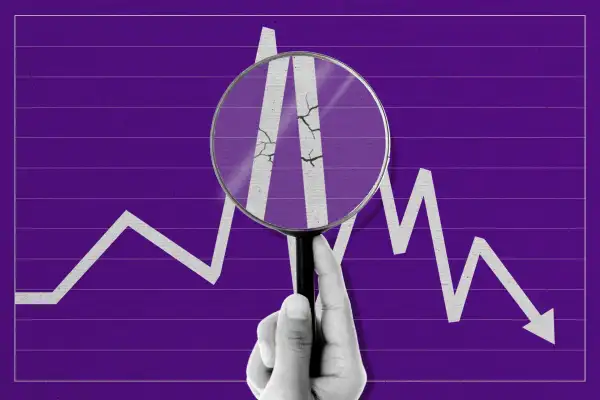
This bond market indicator is spelling bad news for the economy. But does that mean your investment portfolio is also in trouble?
The Federal Reserve raised its interest rates by a quarter of a percentage point last week in its ongoing battle against inflation. The benchmark federal funds rate now sits at a range of 4.5% to 4.75%, and Fed Chair Jerome Powell said in a Wednesday press conference “it would be very premature to declare victory” against price increases that remain stubbornly high.
The Fed’s aggressive push has raised short-term interest rates, which is by design: By hiking rates, the central bank makes it more expensive to borrow money, which is intended to cool the economy and bring down spiraling consumer prices. But these sharply climbing rates are also having a significant impact on the bond market — and a key market indicator.
A key bond market indicator
Typically, U.S. Treasury bonds with longer-dated maturities have higher yields than those with a shorter amount of time to maturity. This is in order to compensate investors for keeping their money tied up longer and exposing it to greater risk, by virtue of the fact that there are a lot more unknowns in a longer time frame.
But right now, the yield on the three-month Treasury is above 4.5%, while the 10-year yield is more than a full percentage point lower. In economist-speak, that means the yield curve is inverted. In plain English, that means bad news for the economy may be looming.
“An inverted yield curve tells us that something is unnatural in market proxies, that there's something wrong in the pricing function of money,” says Bill Merz, head of capital markets research at U.S. Bank Wealth Management. In other words, the usual relationship between a greater risk premium for longer-dated bond yields has been thrown out of whack. (Bond yields move in the opposite direction of prices.)
What is the yield curve?
Technically speaking, the yield curve is a collection of data points rather than a single figure. The term refers to the movement of Treasury yields over time as plotted out on a graph.
Economists look at the relationship between a short-dated bond (say, the 3-month or 2-year Treasury) and a long-dated bond (usually the 10-year Treasury). The yield curve provides insight into the expected future movement of interest rates.
What does the inversion mean?
When the yield curve inverts, as it initially did early last year, that means the yield on a short-term bond is higher than on the long-term version. Some experts prefer to look at the relationship between 2-year and 10-year Treasury yields, while others say comparing 3-month and 10-year Treasuries is more telling. Either way, the narrative right now is similar.
“The yield curve really is seen as an indicator of investors' sentiment about the future of the market,” says Ross Bramwell, principal at wealth management firm Homrich Berg. “When you look at an inverted yield curve, what that’s telling us is that longer term… [investors are] seeing lower growth.”
Right now, Bramwell adds, the yield curve is displaying the steepest inversion of the last 40 years.
Does that mean a recession is coming?
The conventional wisdom is that an inverted yield curve is the harbinger of a recession. Recent inversions have been followed by recessions an average of 18 months later, according to LPL Financial.
For Wall Street, the yield curve serves as an early warning of mounting economic danger.
“The inverted yield curve is one of the more reliable leading indicators of a recession and it has the advantage of being a signal that’s available instantaneously, whereas economic statistics take time to compile and be released,” says Bill Adams, chief economist for Comerica Bank.
Can we rely on the yield curve to predict a recession?
But, dire predictions aside, some experts say there’s more to the yield curve inversion — and what it implies about the state of the economy — than meets the eye.
While an inversion might be a reliable indicator of a recession, it’s actually not a very good indicator for two main reasons, financial pros say. For one, an inversion doesn’t tell investors how far in the future a recession might occur.
“Lead times for between when the yield curve inverts and the onset of the recession is from three months to two years,” says Dan Eye, chief investment officer at Fort Pitt Capital Group. “So it doesn't really tell investors the very important piece of data they would need, which is, when does the recession start?”
Given that slowdowns are a regular, and expected, part of the economic cycle, it’s inevitable that another recession will take place some time in the future. But that event could potentially take place years in the future. An investor who responded to every yield curve inversion as if a recession was dead-ahead could be adopting a defensive posture prematurely and missing out on potential growth.
Secondly, an inverted yield curve doesn’t give investors any visibility into how long or how deep the next recession will be, Eye points out. Again, a flight-to-safety overreaction could mean missing out on a period of growth.
What does this mean for my 401(k)?
Retirement planners and other money-management pros advise against making any big changes to allocations in accounts like 401(k)s and IRAs in response to market phenomenon like the yield curve.
“There's no single indicator that works reliably in a consistent time lag to the point it can be used as a market timing tool,” Merz says.
Even if we are headed for a recession within the next quarter or two, financial advisors tend to recommend staying put as what’s likely to be the best bet for most investors. Research shows that when people panic and cash out of the market when the economy turns rocky, they often miss the early days of the subsequent recovery. That can cost tens of thousands of dollars over the course of a 40-year retirement investment horizon.
Still, market volatility can be a good motivator to check in with your nest egg and make sure that your allocations are in line with your current retirement income goals and risk tolerance.
It’s smart to take a view that encompasses a wide array of data points, Merz says, because looking at the yield curve in isolation could give an investor a distorted frame of reference.
“Do we think it matters? Yes. Are there many other things that matter? Yes,” he says. “It’s one thing in a large mosaic of items we pay attention to.”
More from Money:
A Record Share of Americans Say the Stock Market Is Primed to Fall: Gallup