
#OscarsSoWhite, but These Industries Are Whiter

- These Fidget Spinners Have Dangerous Amounts of Lead for Children, Consumer Group Warns
- 10 Surprising Places to Get Cheap Home Goods, According to Interior Design Experts
- There's a New Netflix Email Scam Going Around. Here's How to Spot It
- One-Third of Middle Class Families Could End Up Paying More Under the GOP Tax Plan, Experts Say
- How Michael Jackson Still Earns Millions After His Death
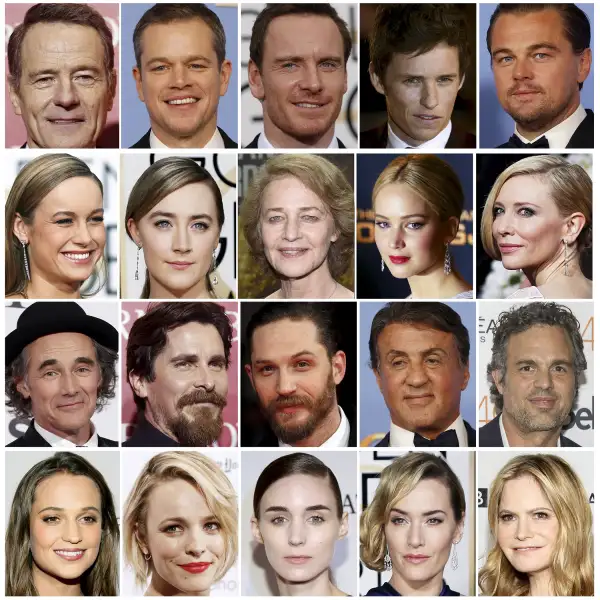
Leonardo DiCaprio finally won his Oscar, but it was talk of Hollywood's lack of diversity that stole the show at the 88th annual Academy Awards.
Host Chris Rock kicked off the festivities by delivering an opening monologue almost exclusively about race in Hollywood and #OscarsSoWhite.
"It's the 88th Academy Awards, which means this whole no black nominees thing has happened at least 71 other times. You gotta figure it happened in the 50s, 60s ... I'm sure there were no black nominees some of those years," Rock said. "And black people didn't protest. Why? Because we had real things to protest at the time ...We were too busy being raped and lynched to care who won Best Cinematographer."
#OscarsSoWhite was a recurring theme throughout the night, with Rock, Kevin Hart, Kerry Washington, Academy president Cheryl Boone Isaacs, and ABC newscaster Robin Roberts all addressing the complete absence of people of color among all acting nominations (and most of the other categories, too, for that matter).
"In this year's In Memoriam, it's just going to be black people that were shot by the cops on the way to the movies," Rock said, in one of the evening's most pointed comments.
"Is Hollywood racist? You gotta go at that the right way. Is it burning cross racist? No. Is it fetch me some lemonade racist? No. It's a different type of racism," he continued. "It's sorority racist: We like you, Rhonda, but you're not a Kappa."
All joking aside, we wondered, how does Hollywood in fact stack up to the rest of the workforce?
Read Next: Why You Should Care About the Hollywood Wage Gap
According to the Bureau of Labor Statistics, the U.S. workforce is 66.1% white, 11.7% black, 16.4% Hispanic or Latino, and 5.8% Asian. When the USC Annenberg School for Communication and Journalism looked at diversity on film, it found that of the top 100 movies of 2014, 73.1% of all speaking or named characters were white, 4.9% were Hispanic or Latino, 12.5% were black, and 5.3% were Asian.
Drilling down even further, the report noted that "only 17 of the 100 top films of 2014 featured a lead or co lead actor from an underrepresented racial and/or ethnic group." The same number of films featured no black speaking character at all, while over 40 movies had no Asian speaking role.
Finally, only 5 of the 107 directors of the year's top 100 films were black, and there were just 19 Asian directors across the 700 top‐grossing films.
How Hollywood Compares
Hollywood may be called on the (red) carpet right now, but there are other industries that fare even worse when it comes to diversity in the workforce. More than 80% of architects are white, for example, as are 81.2% of legal professionals (including 85.5% of lawyers). If we use Annenberg's numbers as a proxy for Hollywood's racial and ethnic breakdown, film acting is one of the more diverse sectors relative to other fields, especially within the arts, design, entertainment, sports, and media occupations. According to the chart below, nearly 84% of "artists and related workers" are white (the BLS does not provide separate breakout data on the race/ethnicity of actors).
That's not to undercut the importance of the spotlight #OscarsSoWhite put on diversity in film. As Money wrote about the Hollywood gender wage gap, representation is an important driver of any type of social change. But looking at which other industries are most lacking diversity will ensure the conversation doesn't stop until the 89th Academy Awards rolls around.
This a sampling of the careers that are disproportionately white (above 80%). Occupations in the arts are highlighted:
| Occupation | Percent White | Percent Black | Percent Asian | Percent Hispanic or Latino |
|---|---|---|---|---|
| All Workers | 66.1% | 11.7% | 5.8% | 16.4% |
| Aircraft pilots and flight engineers | 91% | 2.6% | 0.7% | 5.7% |
| Fundraisers | 89.8% | 7.2% | 1.1% | 1.9% |
| Veterinarians | 89.4% | 3.4% | 4.7% | 2.5% |
| Archivists, curators, and museum technicians | 88.8% | 2.7% | 0% | 8.5% |
| Information security analysts | 88.4% | 3% | 3.4% | 5.2% |
| Veterinary services | 87.7% | 3.1% | 1.7% | 7.5% |
| Advertising and promotions managers | 87.8% | 0% | 5.5% | 6.6% |
| Psychologists | 87.6% | 4.1% | 2.5% | 5.8% |
| Chief executives | 86.8% | 3.6% | 4.7% | 5.5% |
| Directors, religious activities and education | 86.3% | 7.5% | 1.1% | 5.1% |
| Writers and authors | 86.3% | 4.9% | 3.5% | 5.3% |
| Lawyers | 85.5% | 4.6% | 4.8% | 5.1% |
| Environmental scientists and geoscientists | 85.2% | 1.3% | 6.2% | 7.3% |
| Librarians | 83.9% | 8.5% | 2.8% | 4.8% |
| Artists and related workers | 83.8% | 2.7% | 4.1% | 9.4% |
| Editors | 82.4 | 2% | 7.7% | 7.9% |
| Securities, commodities, and financial services sales agents | 82.4% | 4.8% | 5.8% | 7% |
| Producers and directors | 82.3% | 5.3% | 5.6% | 6.8% |
These are the careers that are disproportionately non-white:
| Occupation | Percent White | Percent Black | Percent Asian | Percent Hispanic or Latino |
|---|---|---|---|---|
| Graders and sorters, agricultural products | 23.3% | 18.6% | 3.8% | 54.3% |
| Miscellaneous personal appearance workers | 28% | 7% | 56.5% | 8.5% |
| Maids and housekeeping cleaners | 30.6% | 16.1 | 4.4% | 48.9% |
| Barbers | 32.3% | 40.7% | 6.4% | 20.7% |
| Butchers and other meat, poultry, and fish processing workers | 34.2% | 22.4% | 8% | 35.4% |
| Baggage porters, bellhops, and concierges | 35.6% | 21% | 10.5% | 32.9% |
| Parking lot attendants | 36.1% | 32.1% | 5.3% | 26.5% |
| Packers and packagers, hand | 37.9% | 19% | 5.6% | 37.5% |
| Laundry and dry-cleaning workers | 39.7% | 17.7% | 10.8% | 31.8% |
| Dishwashers | 40.5% | 14.7% | 5.1% | 39.7% |
| Cooks | 40.5% | 18.5% | 5.3% | 35.7% |
| Taxi drivers and chauffeurs | 40.9% | 27% | 15.1% | 17% |
These are a selection of the careers that are disproportionately black:
| Occupation | Percent Black | Percent White | Percent Asian | Percent Hispanic or Latino |
|---|---|---|---|---|
| Barbers | 40.7% | 32.3% | 6.4% | 20.7% |
| Nursing, psychiatric, and home health aides | 37.7% | 41.9% | 5.6% | 14.8% |
| Postal service clerks | 43.5% | 51.5% | 8.7% | 6.3% |
| Crossing guards | 33.2% | 46.4% | 3.1% | 17.3% |
| Parking lot attendants | 32.1% | 36.1% | 5.3% | 26.5% |
| Security guards and gaming surveillance officers | 28.8% | 52.6% | 4% | 18.6% |
| Bus drivers | 28% | 55% | 2.7% | 14.3% |
| Taxi drivers and chauffeurs | 27% | 40.9% | 15.1% | 17% |
| Bailiffs, correctional officers, and jailers | 26% | 61% | 1.2% | 11.8% |
| First-line supervisors of correctional officers | 24.7% | 66.3% | 2.7% | 6.3% |
| Probation officers and correctional treatment specialists | 23.3% | 60.6% | 4% | 12.1% |
| Social workers | 22% | 62.5% | 3% | 12.5% |
These are a selection of the careers that are disproportionately Hispanic or Latino:
| Occupation | Percent Hispanic or Latino | Percent White | Percent Black | Percent Asian |
|---|---|---|---|---|
| Graders and sorters, agricultural products | 54.3% | 23.3% | 18.6% | 3.8% |
| Roofers | 51.2% | 41.4% | 6% | 1.4% |
| Miscellaneous agricultural workers | 50.7% | 44.7% | 3.5% | 1.1% |
| Maids and housekeeping cleaners | 48.9% | 30.6% | 16.1% | 4.4% |
| Carpet, floor, and tile installers and finishers | 47.1% | 44.6% | 6.2% | 2.1% |
| Construction laborers | 45.5% | 44.5% | 8.1% | 1.9% |
| Grounds maintenance workers | 44.5% | 46.7% | 7.9% | 0.9% |
| Brickmasons, blockmasons, and stonemasons | 43.3% | 51.4% | 5.3% | 0% |
| Dishwashers | 39.7% | 40.5% | 14.7% | 5.1% |
| Cleaners of vehicles and equipment | 39.4% | 46.9% | 12.3% | 1.4% |
| Cooks | 35.7% | 40.5% | 18.5% | 5.3% |
| Janitors and building cleaners | 31.4% | 47.6% | 17.6% | 3.4% |
These are a sampling of the careers that are disproportionately Asian:
| Occupation | Percent Asian | Percent White | Percent Black | Percent Hispanic or Latino |
|---|---|---|---|---|
| Miscellaneous personal appearance workers | 56.5% | 28% | 7% | 8.5% |
| Medical scientists | 35.1% | 53.6% | 5.9% | 5.4% |
| Software developers, applications and systems software | 33.8% | 55.8% | 5% | 5.4% |
| Physical scientists | 23.9% | 65.5% | 4.4% | 6.2% |
| Computer hardware engineers | 23.4% | 53.5% | 12.1% | 11% |
| Computer programmers | 18.9% | 67.2% | 7% | 6.9% |
| Aerospace engineers | 18.6% | 66.2% | 2.1% | 6.4% |
| Physicians and surgeons | 18.4% | 68.8% | 6.4% | 19.3% |
| Tailors, dressmakers, and sewers | 17.1% | 55.4% | 5.3% | 22.2% |
| Chefs and head cooks | 16.8% | 48.7% | 15.2% | 19.3% |
| Dentists | 16.8% | 71.7% | 2.9% | 8.6% |
| Financial analysts | 16.2% | 66.3% | 11.1% | 6.4% |