
The Two Charts You Need to See About Thursday's Record Market Highs

Money is not a client of any investment adviser featured on this page. The information provided on this page is for educational purposes only and is not intended as investment advice. Money does not offer advisory services.
The stock market reached new record highs on Thursday, with the Dow and S&P 500 indexes closing at 212.
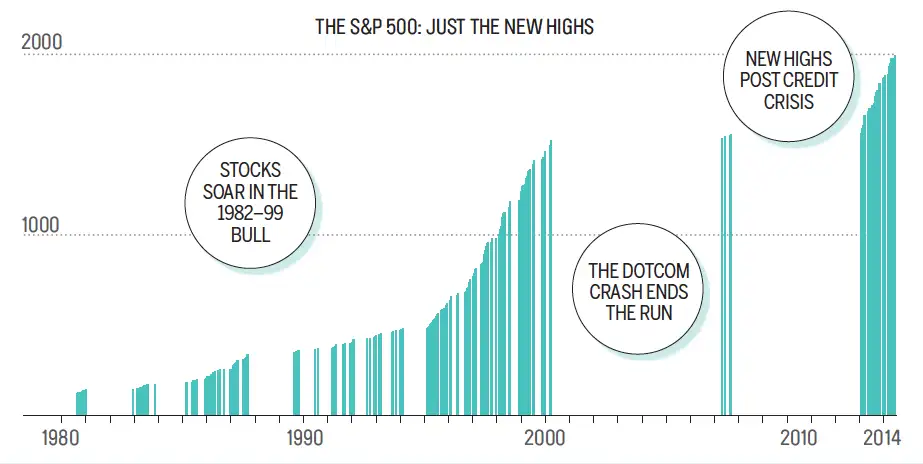
New highs prompt an obvious question: Is the market too high now? But the headline numbers obscure a simple point: Record market highs are not unusual during a bull market—at all. As shown by the chart below, courtesy of my colleague Pat Regnier, record highs can occur again and again for years before the market tumbles.
That's not to say that another market tumble is completely out of the question. The real number to look at isn't the raw price level of the market, but its relative valuation—that is, how much investors are paying for every dollar of earnings companies are providing. (It's the earnings, after all, that ultimately drive stock returns.) By that measure, stocks appear to be on the expensive side (although nowhere near the heights seen during the tech bubble), as Nobel prize-winning economist recently explained to me in this interview. Here's a chart of where stock prices stand using Shiller's preferred measure, the ratio of prices to the past decade of corporate earnings.

But the simple fact of new nominal highs in the market's major indexes is not by itself reason for concern. As investment adviser and blogger Josh Brown points out in the video below, the market has been hitting new highs about once a month on average over the past 65 years.
Read more on...
- Getting Free Help With Your Investment Challenges
- What Is a Fiduciary, and Why Should You Care?
- A Smart Way To Boost Your Tax-Free Retirement Savings
This story is an updated version of a story originally published November 11, 2014.