
Why the Nasdaq Is Back but the Middle Class Isn't

Money is not a client of any investment adviser featured on this page. The information provided on this page is for educational purposes only and is not intended as investment advice. Money does not offer advisory services.
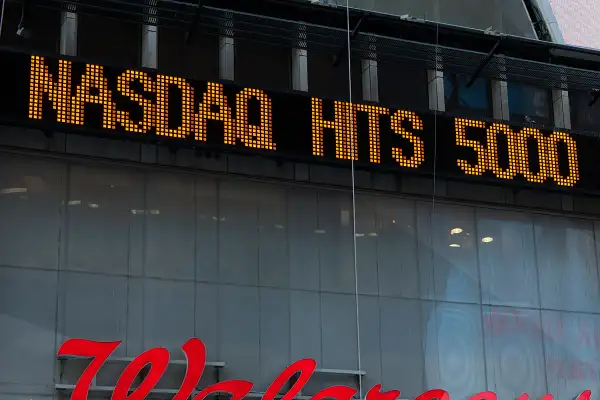
The Nasdaq closed at a record 5,056 on Thursday and investors are having some heady Y2K flashbacks. The tech-heavy index last closed that high in 2000, just before the stock market bubble popped. It was time when electronic trading, tech funds and hot IPOs were middle class obsessions. It felt like everyone could get a piece of the action.
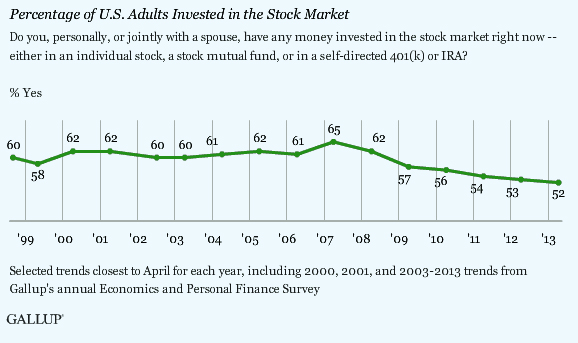
There's some of that boom-boom feeling in air again. (See: Uber, Shake Shack and the growing herd of "unicorns," Silicon-Valley-speak for start-ups valued at $1 billion.) But while the Nasdaq index has returned to prosperity, this stock rally in general has felt like, in investment blogger Josh Brown's words, a rich man's bubble. For one thing, for better or for worse, the percentage of adults invested in the stock market is at its lowest point in decades. The financial crisis forced many middle-income investors to liquidate their stock holdings in order to weather the following years of financial hardship.
And nobody is under the illusion that everyone's getting rich.
A study financed by the Russell Sage foundation found that the median household's net worth declined by $32,000 between 2003 and 2013, from almost $87,992 to $56,335. That means a typical household lost 36% of its wealth in 10 years. Yet in that same 10 year time-span, not only the Nasdaq has boomed back. The S&P 500, the most commonly used indicator of stock market health, is up 60%.
The fact that fewer Americans are invested in the market is only part of the issue. Study co-author Fabian Pfeffer says home equity made up more than half of the median household’s wealth in 2007, just before the housing crash. Worse, the housing market has improved far more slowly than the stock market, resulting in a much slower recovery for middle-income households.

And so volatility has tended to amplify inequality, even when markets eventually bounce back. While the average American was forced to divest from the stock market when shares were (in hindsight now) cheap, wealthier people were not, meaning the latter group has benefited more when the economy improved. Wealthier Americans also had a higher percentage of their wealth outside the real estate market. Pfeffer says the median household in the richest 5th percentile held just 16% of their wealth in home equity, with the rest primarily held in either business assets (49%) or financial instruments like stocks and bonds (25%).
The end result? America's wealthiest households prospered in the aftermath of the financial crisis as the stock market improved, while the middle class was largely passed over. Pfeffer's research found the richest 5% of Americans held 24 times the wealth of the median household in 2013, up from 13 times the wealth of a typical household in 2003. In other words, wealth inequality essentially doubled over the last decade.